seqex concatenation and raxml-ng tree inference
The Seqex tool can filter assembled loci and concatenate them into a supermatrix for phylogenetic inference. This tutorial demonstrates that workflow using the empirical dataset from the single-end denovo assembly tutorial.
Extract and concatenate loci
The command below retains sites represented by at least eight samples, removes
samples with more than 90% missing data, and uses -C to concatenate the
filtered loci into one PHYLIP alignment.
ipyrad2 seqex \
    -d SRP021469/OUT/assembly.hdf5 \
    -o SRP021469/output-seqex \
    -n assembly_min8 \
    -m 8 \
    -r 0.90 \
    -C
ipyrad2 seqex log
2026-07-23 11:55:40 | INFO     | cli_analysis.py      | -------------------------------------------------------
2026-07-23 11:55:40 | INFO     | cli_analysis.py      | ---- ipyrad2 seqex: extract filtered delimited loci ----
2026-07-23 11:55:40 | INFO     | cli_analysis.py      | -------------------------------------------------------
2026-07-23 11:55:40 | INFO     | cli_analysis.py      | CMD: ipyrad2 seqex -d SRP021469/OUT/assembly.hdf5 -o SRP021469/output-seqex -n assembly_min8 -m 8 -r 0.90 -C
2026-07-23 11:55:40 | INFO     | sequence_windows.py  | No windows specified; selecting the full length of all scaffolds. Use -w to subset scaffold windows and -P to view scaffold names.
2026-07-23 11:55:40 | INFO     | sequence_windows.py  | selected 45448 windows from 45448 scaffolds
2026-07-23 11:55:46 | INFO     | seqex.py             | wrote 29339 filtered loci concatenated into one PHYLIP alignment to: /home/deren/Documents/tools/ipyrad2/SRP021469/output-seqex/assembly_min8.phy
2026-07-23 11:55:46 | INFO     | seqex.py             | wrote stats report to: /home/deren/Documents/tools/ipyrad2/SRP021469/output-seqex/assembly_min8.stats.txt
Without -w, seqex considers every complete locus in the assembly. This is
usually the desired behavior for a de novo assembly, where each assembled RAD
locus is stored on its own scaffold. Alternatively, you could use -N to specify
a random number of loci to sample. If you had a reference-based assembly, you could
alternatively specify a specific window of the genome to extract loci from.
For this example, seqex writes a 13-sample alignment containing 1,965,012 sites. Other stats about the written alignment, including which loci were retained and the amount of missing data per-sample, and in total, can be examined in the stats file:
head -n 100 SRP021469/output-seqex/assembly_min8.stats.txt
# Seqex Summary
command: ipyrad2 seqex -d SRP021469/OUT/assembly.hdf5 -o SRP021469/output-seqex -n assembly_min8 -m 8 -r 0.90 -C -f
data: SRP021469/OUT/assembly.hdf5
output_layout: concatenated
out_format: phy
cores: 1
max_loci: all
random_seed: none
min_length: none
clipping_mode: automatic
coordinate_clipping_applied: false
windows_selected: 45448
selected_windows: none
candidate_loci: 45448
rejected_raw_length: 0
rejected_locus_coverage: 16107
rejected_site_coverage: 2
rejected_sample_missing: 0
rejected_filtered_length: 0
accepted_before_sampling: 29339
written_loci: 29339

# Output Summary
total_sites_written: 1965012
total_bases_written: 25545156
full_matrix_bases: 25545156
non_missing_bases: 21156871
non_missing_occupancy: 0.828215
max_samples: 13
mean_samples: 13.000000

# Sample Occupancy
sample                  population  written_final  loci_written  loci_dropped_by_r  matrix_bases  non_missing_bases  non_missing_occupancy
----------------------  ----------  -------------  ------------  -----------------  ------------  -----------------  ---------------------
29154_superba           all         yes                   21725               7614       1965012            1449364               0.737585
30556_thamno            all         yes                   27404               1935       1965012            1834296               0.933478
30686_cyathophylla      all         yes                   25142               4197       1965012            1679531               0.854718
32082_przewalskii       all         yes                   14977              14362       1965012             989772               0.503698
33413_thamno            all         yes                   19779               9560       1965012            1314906               0.669159
33588_przewalskii       all         yes                   16772              12567       1965012            1109317               0.564534
35236_rex               all         yes                   27969               1370       1965012            1872238               0.952787
35855_rex               all         yes                   27945               1394       1965012            1869489               0.951388
38362_rex               all         yes                   27903               1436       1965012            1867746               0.950501
39618_rex               all         yes                   25294               4045       1965012            1690614               0.860358
40578_rex               all         yes                   28234               1105       1965012            1889476               0.961560
41478_cyathophylloides  all         yes                   27428               1911       1965012            1835060               0.933867
41954_cyathophylloides  all         yes                   26257               3082       1965012            1755062               0.893156

# Written Loci
locus_index  locus                 source_locus          selected_window      clipped  raw_samples  raw_sites  filtered_samples  filtered_sites  concat_start  concat_end
-----------  --------------------  --------------------  -------------------  -------  -----------  ---------  ----------------  --------------  ------------  ----------
          1  locus_1_1:1-69        locus_1_1:1-69        locus_1_1:1-69       no                13         69                13              68             1          68
          2  locus_2_1:1-69        locus_2_1:1-69        locus_2_1:1-69       no                13         69                13              69            69         137
          3  locus_3_1:1-69        locus_3_1:1-69        locus_3_1:1-72       no                13         69                13              69           138         206
          ...
Infer a concatenation tree
Run RAxML-NG on the concatenated alignment. The --all workflow performs a tree search and
bootstrap analysis; --bs-trees 100 requests 100 non-parametric bootstrap replicates.
raxml-ng \
    --all \
    --msa SRP021469/output-seqex/assembly_min8.phy \
    --model GTR+G \
    --bs-trees 100 \
    --workers 2
Root and view the tree
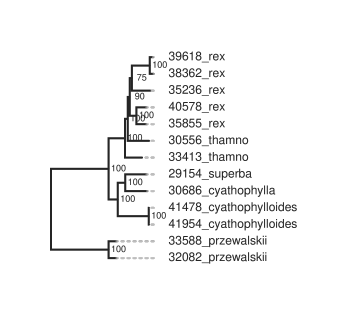
The default RAxML-NG result files are written beside the input alignment. Let's use the Python package toytree to create a drawing of the resulting tree. The code below is Python. I suggest opening a jupyter notebook which will allow you execute the code below and see the resulting plots interactively.
import toytree

# enter the path to your NEWICK tree file written by raxml-ng
NEWICK = "SRP021469/output-seqex/assembly_min8.phy.raxml.support"

# load the NEWICK as a ToyTree object
tree = toytree.tree(NEWICK)

# optionally re-root the tree on an outgroup (here selecting names matching 'prz')
rtree = tree.root("~prz").ladderize()

# draw the tree; returns multiple objects
canvas, axes, mark = rtree.draw(
    tip_labels_align=True,
    node_mask=(0, 1, 0),
    node_labels="support",
    node_labels_style={
        "anchor-shift": "10px",
    },
)
Modify the draw parameters above until you are happy with your tree drawing. See the toytree documentation for drawing options. Finally, you can save/export the tree drawing as a PNG, PDF, SVG, or HTML file.
toytree.save(canvas, "./tree-drawing.png")