Fundamentals of Evolution
EEEB G6110
Session 10: Phylogenetics II
Recap topics
1. Homology
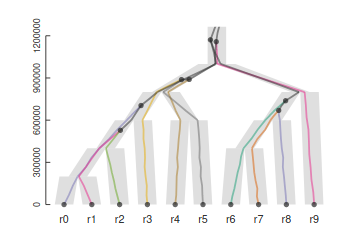
2. Genealogy, gene trees and species trees
3. Trees as data
4. Phylogenetic inference
Section topics
1. Phylogenetic inference
2. Likelihood and model-based inference
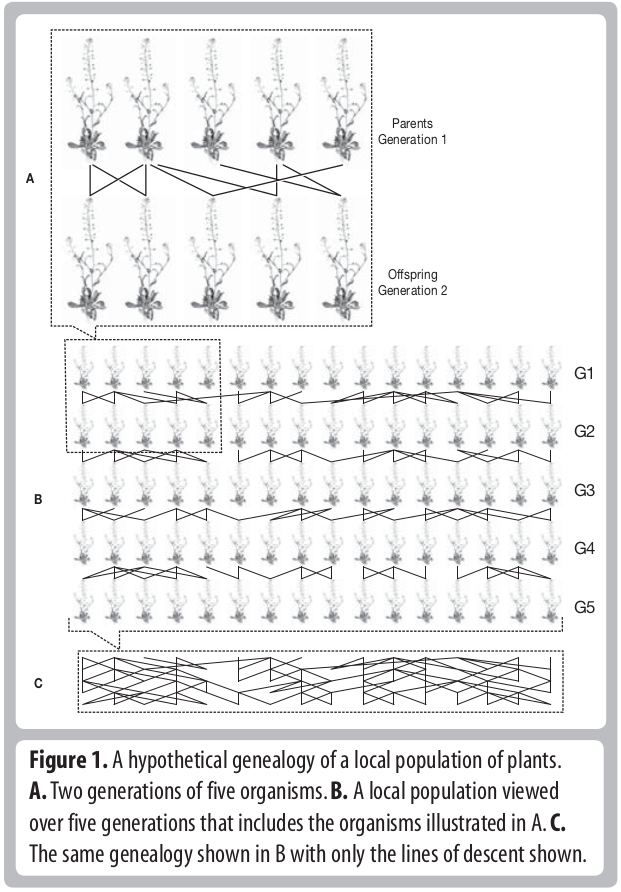
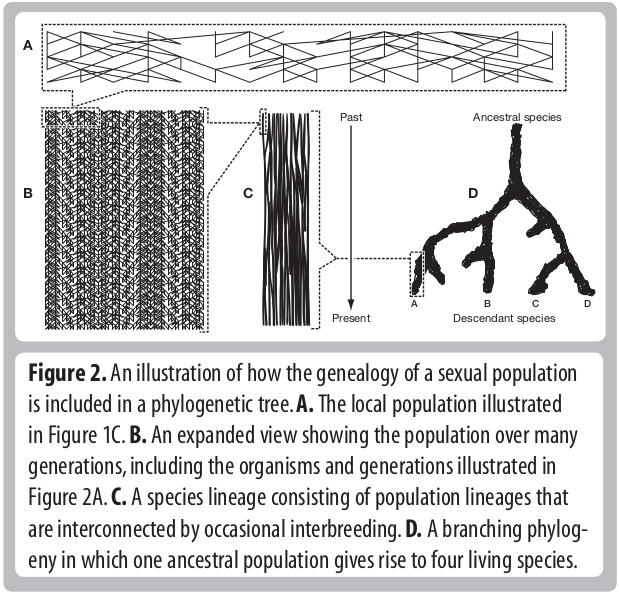
Descent and common ancestry
Homology, homoplasy and Hemiplasy
Are the characters descended from a common ancestor? Has the character state evolved multiple times? Does the evolutionary relationships of genes controlling this trait match the evolutionary relationships of the species?
Coding characters
Discrete data: DNA is discrete, there are only four possible states (A,C,G,T). But what about body mass, height, color, etc.
Characters weighting: Is one trait more informative than another? How to avoid biased sampling of characters?
Why not only use DNA?: For phylogenetics of extant taxa we mostly do. But morphology is still very relevant to phylogeny of extinct taxa (e.g., dinosaurs) and placing fossils with extant taxa
DNA (nucleotides) as characters
heritable: DNA and amino acid differences are heritable, not plastic.
homology: can be inferred by comparing sequences using alignment algorithms. The spatial location of nucleotides in the genome provides evidence of its homology.
models: informed evolutionary models can be used to estimate rates of character change (e.g., random or non-random rates).
availability and bias: Huge amounts of data are available and there is no inherent bias or expectation that certain parts of the genome (characters) should support one hypothesis more than another.
Phylogenetic inference: methods
Collect/measure homologous characters for some number of taxa. For DNA, identifying homology typically involves targeting regions of the genome using primers, or mapping sequenced reads from the genome to the same region of a reference genome. Either way, it is based on sequence similarity. This is typically followed by a more rigorous multiple sequence alignment.

Phylogenetic inference: methods
A general outline of phylogenetic inference:
1. Propose a starting tree (e.g., random or star).
2. Score based on some criterion (e.g., distance, parsimony, likelihood).
3. Modify to propose a new tree, return to step 2.
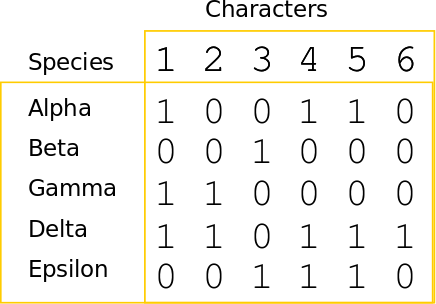
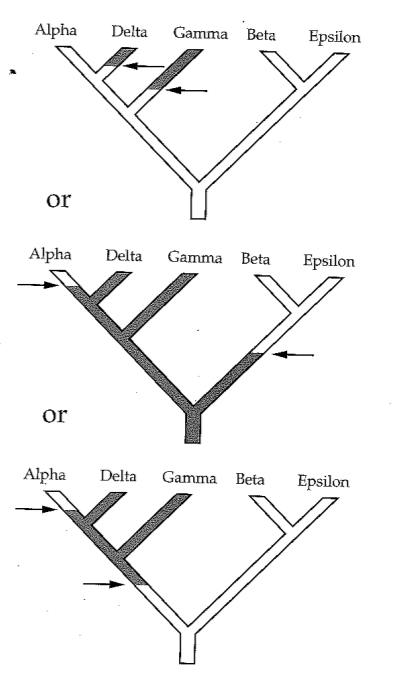
Phylogenetic inference: Parsimony
A character matrix and a topology. Count the number of character state changes.
Phylogenetic inference: methods
Parsimony's pitfall: Homoplasy
It does not account for homoplasy (repeated mutations to the same site). Or other patterns of varying rates of character change.
Inferring the past from the present
Statistical modeling is widely used in evolutionary research
to test or compare hypotheses and to estimate model parameters.
A model describes a mechanistic (probabilistic) process that could produce observable data. It is especially useful when
we cannot observe the past, but we can observe data at the present.
Models, Probability, and Likelihood
The use of statistical models for historical inference
is not unique to evolution, or biology, although many statistical methods were developed by biologists (e.g., the Likelihood framework was developed by the geneticist R.A. Fisher)
A likelihood function describes the probabilitiy of a set of observations given a set of model parameters.
Likelihood can express the probability of a DNA sequence alignment given a phylogenetic hypotheses, or it can express the probability that a coin toss will turn up heads versus tails.
What do we mean by a model parameter?
Models, Probability, and Likelihood
The coin toss example:
We can describe a statistical model for the outcome of a coin toss. For a single trial (a toss) there are only two possible outcomes, H or T. The probability of H is unknown. If the coin is fair then p=0.5, but maybe p!=0.5.
The probability of observing data ($D$) given model parameters ($\Theta$) is described by a likelihood function:
$$ L(\Theta) = f(D | \Theta)$$
The observed data are fixed. The function evaluates the data given proposed values for $\Theta$ and returns a score (the likelihood) for how well the parameters explain the observed data under a given model.
The goal of maximum likelihood
is to estimate $\Theta$ by finding the value that maximizes $L(\Theta)$
Models, Probability, and Likelihood
The coin toss example:
Imagine we observe the following sequence of tosses:
$$ H, T, T, H, H, H, T, T, H, H, T, T, T$$
There are multiple ways in which to describe a likelihood function based on this observation to test different hypotheses. One hypothesis we may wish to ask is whether the probability of each trial is fair (prob. heads = 0.5).
By probability theory, the outcome of many independent events is the product of their probabilities. For example, the probability of flipping heads 5 times in a row using a fair coin is:
$$ 0.5 * 0.5 * 0.5 * 0.5 * 0.5 = 0.03125 $$
Models, Probability, and Likelihood
The coin toss example:
In other words, the joint probability of multiple independent events is computed as:
$$ P(A, B) = P(A) * P(B) $$
In other words, the joint probability can be calculated as the product of many independentprobabilities:
$$ P(A_{i}) = \Pi_{i} P(A_{i}) $$
The likelihood of 5 heads in a row when p=0.5 is very low.
$$ L(\Theta=0.5) = 0.5 * 0.5 * 0.5 * 0.5 * 0.5 = 0.03125 $$
Models, Probability, and Likelihood
The coin toss example:
In other words, the joint probability of multiple independent events is computed as:
$$ P(A, B) = P(A) * P(B) $$
In other words, the joint probability can be calculated as the product of many independentprobabilities:
$$ P(A_{i}) = \Pi_{i} P(A_{i}) $$
But, the likelihood of 5 heads in a row when p=0.99 is quite high.
$$ L(\Theta=0.99) = 0.99 * 0.99 * 0.99 * 0.99 * 0.99 = 0.9509 $$
The likelihood function
The coin toss example:
The likelihood function for the probability of heads based on observed coin tosses describes the probability that a coin comes up heads (p) or tails (1-p). Since tails is just one minus heads there is only one parameter (p). The observed data is simply the number of trials (n) and the number of trials that came up heads (h):
$$ L(p) = p^{h} * (1-p)^{n-h}$$
The likelihood score depends only on the parameter (p) and the observation (n, h).
$$ L(\Theta=0.5) = (0.5)^{5} * (1-0.5)^{0}$$
$$ L(\Theta=0.99) = (0.99)^{5} * (1-0.99)^{0} $$
Statistical phylogenetics
The likelihood function calculates probability of observing a character state (DNA site in an alignment) under a specific model of molecular substitution and a phylogenetic tree (more on these soon).
Simplest models treat each DNA site independently so that the likelihood of a sequence alignment (many sites) is simply the product of the individual site likelihoods:
$$ L(D) = \prod_{i=1}^{n} L(D_{i}) = \prod_{i=1}^{n} f(D_{i} | \Theta) $$
Statistical phylogenetics
By only knowing the results of coin tosses that occurred in the past we are able to estimate the model parameters that are most likely to have produced them (i.e., the probability the coin toss is heads or tails).
The same principle applies to estimating the evolutionary distance between two aligned DNA sequences. Looking only at the results of an evolutionary process that occurred in the past we can estimate the model parameters that are most likely to have produced the DNA differences between a set of taxa.
Whereas the coin toss problem assumed a Bernoulli distribution as the underlying model, for DNA substitutions we use a molecular substitution model, which is a type of Continuous Time Markov Model.
Molecular Substitution Models
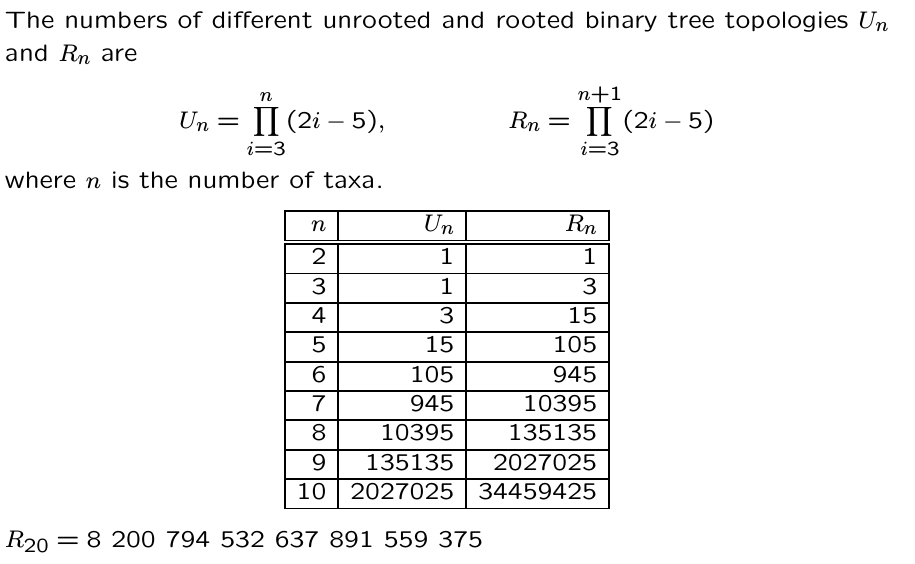
Many mutations occur that are not observable in the present-daty samples alone due to homoplasy (repeated mutations to the same sites).
Molecular Substitution Models
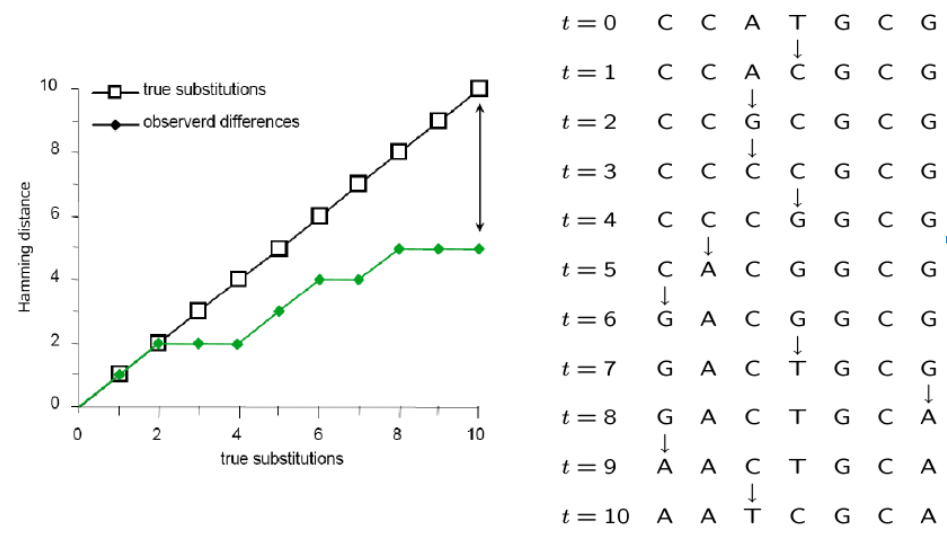
Instantaneous transition rate matrix ($Q$): Similar to the coin toss example, where q was equal to 1-p, you can see that the probability of not changing over some length of time is simply (1 - probability of changing.)

https://en.wikipedia.org/wiki/Models_of_DNA_evolution
Molecular Substitution Models
Transition-probability matrix: the probability of change between states over some time interval (t) is easily calculated as $ P(t) = e^{Qt} $. This tells us the probability of starting in some state (e.g., A) and ending as another (e.g., T). Jukes-Cantor Model predicts equal prob. for any state over very long branches.
https://en.wikipedia.org/wiki/Models_of_DNA_evolution
Markov Process Models
A Markov Process is a random process in which the future state is not dependent on past states, but only on the present. (It is memory-less.)
These types of models are used extensively in evolutionary modeling, and in many other fields. Made up of a set of discrete states, starting frequencies, and a mechanism for transitioning between states.
Can be used to infer parameters (describing an unobserved process) that are most likely to produce observed data. For example, we model changes occurring in DNA sites as a Markov process.
Markov Models for Evolutionary Inference
Markov models are widely used in evolution beyond tree inference. For example, to describe the evolution of a discrete character along branches of a tree. This is similar to the evolution of nucleotide substitutions, but can be the presence or absence of a binary trait, or a biogeographic state.
link to review of this paper.