Linking Phylogenetic Inference at Genome-wide and Genealogical Scales

Deren Eaton and Patrick McKenzie
Ecology, Evolution, and Environmental Biology, Columbia University
Genealogical variation
Genomes are composed of a mosaic of segments inherited from different ancestors,
each separated by past recombination events.

Consequently, genealogical relationships vary spatially across genomes.
Multispecies coalescent assumptions
The multispecies coalescent (MSC) describes the expected distribution of unlinked genealogies, as a function of demographic model parameters (N$_e$, $\tau$, topology).

Multispecies coalescent assumptions
The multispecies coalescent (MSC) describes the expected distribution of unlinked genealogies, as a function of demographic model parameters (N$_e$, $\tau$, topology).

The expected distribution of linked genealogical variation is poorly characterized.
What is the expectation for the distribution of
linked genealogical variation?
How does it relate to demographic model parameters?
Why care about local genealogical variation?
- Subsampling unlinked loci effectively discards >99% genomic info.
- Ignoring linkage introduces bias (concatalescence; Gatesy 2013).
- Local ancestry is informative about selection and introgression.
Why care about local genealogical variation?
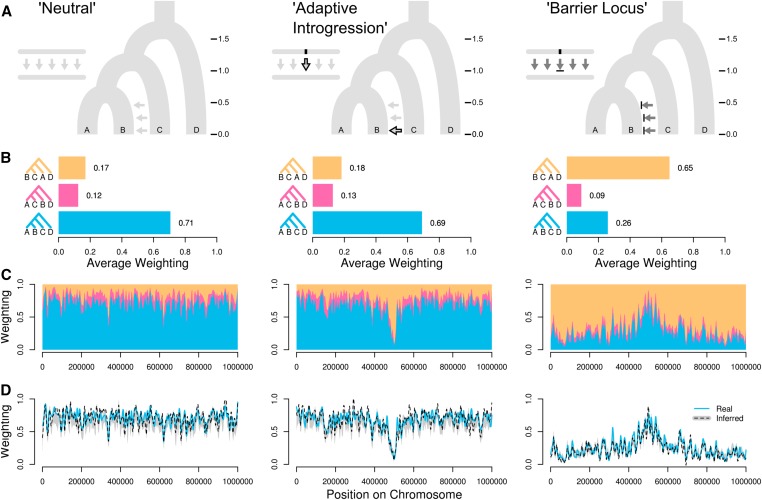
(Martin & Belleghem 2017)
Why care about local genealogical variation?
- Subsampling unlinked loci effectively discards >99% genomic info.
- Ignoring linkage introduces bias (concatalescence; Gatesy 2013).
- Local ancestry is informative about selection and introgression.
- We lack a null expectation for spatial genealogical variation.
Outline: Multispecies Sequentially Markov Coalescent
- Background: SMC' model.
- SMC' waiting distances (Deng et al. 2021) in a single population.
- Introduce our new model for MS-SMC' waiting distances.
- Validate solutions against stochastic coalescent simulations.
- Demonstrate likelihood framework to use waiting distances to fit models.
Sequentially Markov Coalescent (McVean and Cardin, 2005)
An approximation of the coalescent with recombination
Given a starting genealogy a change to the next genealogy is modeled as a Markov process — a single transition — which enables a tractable likelihood framework.
Process: recombination occurs w/ uniform probability anywhere on a tree (t$_{1}$), creating a detached subtree, which re-coalesces above t$_{1}$ with an ancestral lineage.

SMC' is widely used in HMM methods
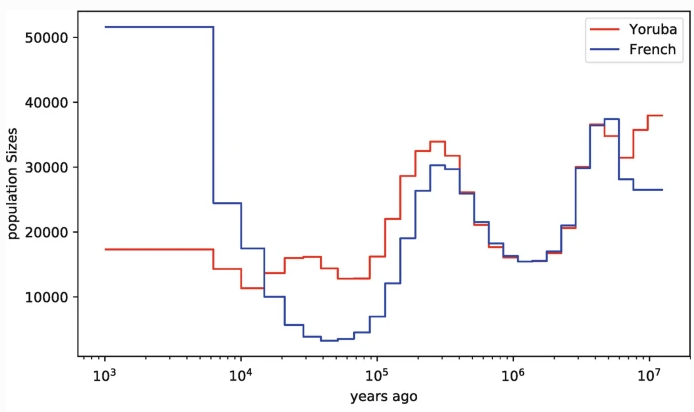
PSMC (Li & Durbin 2011), MSMC (Schiffels & Durbin 2014), use pairwise coalescent times between sequential genealogies to infer changes in N$_e$ through time.
ARGweaver (Rasmussen et al. 2014) and ARGweaver-D (Hubisz & Siepel 2020) use an SMC'-based conditional sampling method to infer ARGs from sequence data.
Currently, we extract a fairly limited amount of
spatial information from genomes.
Categorical event outcomes under the SMC'
(a) no-change; (b-c) tree-change; and (d) topology-change.

(Deng et al. 2021)

Estimating waiting distances under the SMC'
Expected Tree and Topology Distances represent new spatial genetic information.

Estimating waiting distances under the SMC'
Expected Tree and Topology Distances represent new spatial genetic information.

Estimating waiting distances under the SMC'
Expected Tree and Topology Distances represent new spatial genetic information.

A multispecies extension to estimating waiting distances
Barriers to coalescence and variable N$_e$ among species tree intervals.


Patrick McKenzie
PhD student
Extending SMC' waiting distance estimation
Genealogy embedding table with piecewise constant coal rates in
all intervals between coal events or population intervals.

MS-SMC' analytical solutions


Exponentially distributed waiting distances
Expected number of sites until a recombination event is observed.
Exponentially distributed waiting distances

Validation:
Analytical results match expectation of stochastic coalescent simulations.

Validation:
In single population model (Deng et al.) N$_e$ only affects edge lengths.

Validation:
In an MSC model N$_e$ affects probability of tree/topology change as well as edge lengths.

Likelihood framework
Given an observed/proposed ARG (genealogies and interval lengths)
get expected waiting distance for each ($\lambda_i$)...

... and calculate likelihood of MSC model $\mathcal{(S)}$ from exponential probability densities.
Likelihood surface: single N$_e$
Topology-changes are more informative than tree-changes; optima at true sim. values.
Example: loci=50, length=0.1Mb, recomb=2e-9, samples-per-lineage=4.

Joint inference of multiple MSC model parameters
Metropolis Hastings MCMC converges on correct w/ increasing data.
Example: loci=50, length=0.1Mb, recomb=2e-9, samples-per-lineage=4.

Summary: Multispecies Sequentially Markov Coalescent
- We extended method of Deng et al. (2021) to MSC models
- Analytical solutions for E[waiting distance] to tree or topology change
- Validated: accurate against stochastic coalescent simulations
- MSC models predict more informative statistics (waiting distances) about linked genealogical variation than a single population model.
- A big step towards estimating MSC models from linked genome data!
- Topology-changes are easily detactable in sequence data.
Future directions
- Manuscript on biorxiv (hopefully soon also in print)
- Implemented at https://github.com/eaton-lab/ipcoal/
- Software to analyze real genetic data is a future development
- Extensions to Multispecies Network Coalescent.
- and more...
